Visualisation
This addon provides various visualisation blocks for Composr, including:
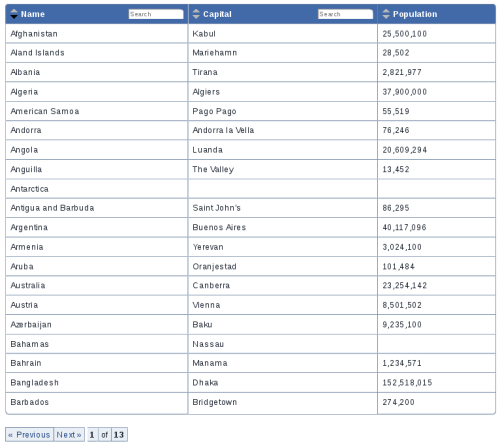
To use the main_sortable_table block, place a CSV spreadsheet file in uploads/website_specific, and place the block on a Comcode page like:
(example.csv is supplied with the addon)
We will automatically detect what columns can be filtered, how to sort each column, and display numbers in an attractive way. Additionally though, the block has many advanced options for customising the output.
Sample spreadsheet files for all the other blocks are provided under uploads/website_specific/graph_test/ and a page of sample usage is provided at site:_graph_test. There is currently no UI/documentation for how to use the blocks, but if you look at the code you can see what parameters are available.
Maximum software version: 11.9
- Sortable tables served from spreadsheets or database tables (main_sortable_table)
- Bar charts from spreadsheets (graph_bar_chart)
- Line charts from spreadsheets (graph_line_chart)
- Pie charts from spreadsheets (graph_pie_chart)
- Scatter diagrams from spreadsheets (graph_scatter_diagram)
- Maps with pins from spreadsheets (pins_on_map)
- Maps with country data overlaid from spreadsheets (countries_on_map)
To use the main_sortable_table block, place a CSV spreadsheet file in uploads/website_specific, and place the block on a Comcode page like:
Code
[block=""example.csv""]main_sortable_table[/block]
We will automatically detect what columns can be filtered, how to sort each column, and display numbers in an attractive way. Additionally though, the block has many advanced options for customising the output.
Sample spreadsheet files for all the other blocks are provided under uploads/website_specific/graph_test/ and a page of sample usage is provided at site:_graph_test. There is currently no UI/documentation for how to use the blocks, but if you look at the code you can see what parameters are available.
System Requirements / Dependencies
IE 11+Website Software Requirements
Minimum software version: 11Maximum software version: 11.9


0 reviews: Unrated
There have been no comments yet