Composr Tutorial: Statistics for your site (analytics)
Written by Chris Graham and Patrick Schmalstig
Lots of statistics types are available
(Click to enlarge)
Composr has a sophisticated statistics system.
Google Analytics vs Composr statistics
Google Analytics is extremely popular free tool for website owners and marketers for viewing website statistics. For that reason, I am starting the tutorial by directly addressing this.We intentionally do not try and 'compete' with Google Analytics. There is significant overlap but Composr statistics and Google Analytics are complementary tools. Here are some key differences:
- Pros for Google Analytics:
- Google Analytics is a very sophisticated and complicated product that provides a lot of functionality to professional marketers. Composr statistics is fairly straight-forward.
- Integration with other Google products, such as Google AdSense (to see what is producing AdSense income, for example).
- Integration with Google Search Console (for SEO hints).
- Google Analytics has access to insights from Google's own marketing. For example, it can show statistics of genders of visitors.
- Cons:
- Google Analytics ultimately only knows about web visits to URLs, unless you do custom programming or complex configuration. Composr statistics has much more contextual information (e.g. knowing how Composr pages work), and can draw graphs for things beyond just web visits (e.g. sales).
- Google Analytics uses JavaScript to initiate tracking. Composr does tracking server-side, not relying on JavaScript, and thus not subject to web browser configuration/blocking. While Composr by default does require JavaScript to display pages, views will still be logged even if JavaScript is not enabled by users.
- Google Analytics uses tracking cookies, which is a privacy concern and questionable under legislation such as GDPR. Composr doesn't use anything beyond regular IP addresses, session IDs, and member IDs.
- Google Analytics is a product of a large multi-national corporation that makes money through targeted advertising, and has a number of major controversies around it (e.g. it is highly probable your analytics data is being sold to third-party data brokers or used for targeted advertising in Google AdSense). Composr statistics is hosted only on your own website and under your complete personal control.
- Google Analytics is closed source. Composr statistics is just another bundled Composr addon, and therefore fully Open Source.
Basic users may be happy with only Composr statistics, especially given the privacy and freedom around big-tech marketing. Expert marketers will likely want the power of Google Analytics, there is no doubting it is an extremely powerful tool and a professional standard.
Google Analytics is easy to set up in Composr as we have support built-in: you just need to enter your analytics code in the Composr configuration.
The administration module
An example statistics page: Content growth
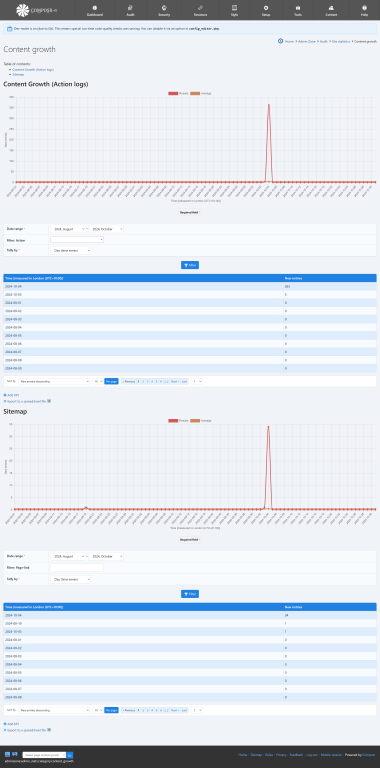
(Click to enlarge)
Be aware that hits coming from the web server itself will be filtered from the stats (this is intentional because often Composr needs to call itself on the web), so if you are running a web server on your own computer you may not see any results if nobody else has used your website yet.
Installing geo-location data (maintenance status)
The install and update of geolocation data is usually automatic because the Composr installer creates a background task for it (also, the core_locations addon creates a background task on every update to ensure the data gets updated in the database).Once the geo-location data is installed, all the extra statistics can be used.
Categories and Graphs
The statistics module splits up the graphs into a number of categories. The exact categories and graphs available depend what addons you have installed, and to some extent your configuration – at the time of writing, there are over 65.There are a large number of different graphs available for viewing, and most of them function in an obvious way. This documentation section will highlight some specifics that are not so obvious.
Tally by
You can set time-based graphs to tally records (pivot) in different ways. There are 2 kinds of tallying:- time series – this groups all records into chunks of continuous time, and puts the tallies on a graph
- flow pattern – this groups all records by repeating patterns of time; for example, you can show a tally of all the records that happened at 2pm (regardless of date)
Time series show as a line graph, while flow patterns show as a bar chart.
Audience: demographics
Demographics graphs give you an idea who your users are. It may help you have an idea who you need to work harder for – be that attracting new audiences, or doubling down on what you now understand as your core audience.At the time of writing, only age and requested language are available analytics. This is because these are the only built-in pieces of demographic information Composr gathers from members. Gender, for example, is not a built-in field but can rather be implemented as a Custom Profile Field (which statistics do not track). The same is true for location fields. You could write your own statistics hooks to track CPFs if you desired.
Audience: technical
These graphs get into the more technical aspects of your audience, such as what devices they are using to access your site, what operating systems they run, and more. You can utilise these statistics to make decisions, for example, on your theme's design and behaviour to accommodate the most people.Content growth
This category presents two different ways to measure your site's content growth over time:- Action logs, which is primarily an indication of how often content is getting added, updated / revised, and removed (unlike the Action Logs graph in Feedback and engagement, this graph focuses specifically on content-based actions)
- sitemap, which is primarily an indication of physical content growth on your site
Conversions
This is a very important category which indicates when visitors show interest (or lack thereof) in your site / company / products. There are various activities that indicate a visitor's interest:- when they sign up for your newsletter
- when they create an account (joining)
- when they purchase a usergroup subscription
- when they click on tracking links / codes you publish (especially in newsletters or on external sites)
This category also tracks when visitors request to be unsubscribed from all e-mails from your site. This usually indicates the urgent need to improve e-mail marketing efforts and to be less spammy.
Economic activity
These graphs give a general overview of your site's economy. This includes points, banners, and eCommerce.Feedback and engagement
These graphs give you an overview of the engagement between you / your site and your members. It also lists your top members based on views, forum posts, and points.The Action Log graph in particular gives you a broad idea of how engaging your members are with the site and how many times they perform an action.
Forum
The forum category is better thought as a sub-category of Feedback and engagement. It showcases the activity within your forums: the number of new topics and posts created, and votes in topic polls.Hits
The 'Views per day of content existing' graph tallies and displays top content results based on average number of views per day to existing content. This is different from 'Content views' which tallies overall view counts to a piece of content.The 'Views' page counts the number of page views.
The 'Unique views' graph counts the number of unique members or human-like IP addresses which viewed your site in the given pivot period. Note that this is an over-estimation; likely the number is slightly less because people on changing IP addresses will count more than one time.
Inter-member engagement
These graphs are better thought as a sub-category of Feedback and engagement. They showcase how much your members are interacting with each other through Private Topics and Posts, and through sending each other points.Punitive actions
These graphs give you an overview of the number of warnings issued over time, a break-down of warnings by reason, and the punitive actions which were used.Referrers and referrals
There are various graphs that show referrers to your website, broken down in different ways. A referrer is a web page from another website that is linking to you.Such data is invaluable in finding out what advertising is working (and conversely which advertising schemes aren't working), potential partners, the nature of your traffic, etc.
This category also includes invitations for when invites are enabled on your site.
Search traffic
These graphs give you an overview of what people are searching for (and how often) on your site.Security
These graphs outline logged security issues such as hack attacks and failed logins.Server performance
These graphs can give you an overview of how well your site is performing from a server perspective (e.g. page speeds, e-mails queued or sent). These graphs are very broad. For more detailed, thorough, and automatic checks, we recommend using the health_check addon (bundled by default).Session behaviours
There are various graphs that will tell you about user sessions. These are telling you about the broader flow of users, and in particular how they enter and exit your website. This is important information to help you understand your users, and perhaps see what needs further work and what are strong points.Performance
The load times and page speed graphs tell you about website performance. This is useful for:- Getting an overall idea of how fast your website is
- Getting an idea what specific pages may be slow.
The times quoted are just server page generation time. It doesn't count any time taken transferring pages to the user, or for the user to download the page and page components (images etc).
This is useful information for optimising your site; finding bottlenecks and jams. For example you may find where things could be spread out more (e.g. putting fifteen blocks on different pages, instead of putting them all on the same one).
If web pages are taking seconds to just generate, you have a problem.
Filters
Most of the filters where you enter text for filtering support the ? and * wildcards.Events
You can track arbitrary events of your choosing, and also some events are automatically tracked (such as members joining).There is a graph that lets you see how many of each events happen, and also graphs showing the percentage rates of events happening for sessions, and the percentage rates of events happening for sessions originating from any tracking code.
Other software may use terms such as 'goals' or 'conversions': these are roughly equivalent to Composr 'events'.
There are a number of ways to record events happening:
- The inbuilt events are recorded automatically.
- You can use the {\$LOG_STATS_EVENT,event} symbol to track an event from within your templates (i.e. when the template is shown, the event is recorded).
- You can use the JavaScript $cms.statsEventTrack function to track an event from within JavaScript code.
- You can use add data-click-stats-event-track="{ category: 'some event', nativeTracking: true }" on HTML <a> elements. This is actually a wrapper around the above.
- You can wrap URLs in links with the {\$STATS_TRACK_URL,URL,event} symbol.
E.g. <a href="{$STATS_TRACK_URL*,https://example.com/,Example.com Link clicked}">Click me</a>
This handles the event recording within a redirection script, so does not depend on JavaScript. It also will track the external URL as having been viewed regardless of the event (the event parameter is actually optional).
Note that '3' and '4' also integrate with events within Google Analytics. Google Analytics integration is all about JavaScript code.
Here are the inbuilt events…
| Event description | Event name | Event parameter | Event origin | Used with Google Analytics | Used with inbuilt stats system (by default) |
|---|---|---|---|---|---|
| Form filled in | Form | <formName> | Server-side | No | Yes |
| Purchase | eCommerce | <productName> | Server-side | No | Yes |
| Newsletter signup | Join newsletter | Depends | Yes | Yes | |
| Click banner | Banner | <bannerCodename> | JavaScript | Yes |
No (the banners module tracks clicks) |
| Click Comcode link | URL | <url> | JavaScript | Yes |
No (In statistics, See Hits > Content views) |
| Click system links put out for many things (the HYPERLINK.tpl template) | URL | <url> | JavaScript | Yes |
No (In statistics, See Hits > Content views, and Hits > Popular Pages) |
| Download a download | Download | <filename> | JavaScript | Yes |
No (In statistics, See Feedback and Engagement > Downloads; also the downloads module tracks this) |
| Download an attachment | Attachment | <filename> | JavaScript | Yes | No |
| Play attachment audio | Audio | <url> | JavaScript | Yes | Yes |
| Play attachment video | Video | <url> | JavaScript | Yes | Yes |
| Open attachment overlay | Image | <filename> | JavaScript | Yes | No |
| Create support ticket | Create support ticket | JavaScript | Yes |
No (In statistics, see Feedback and Engagement > Support Tickets) |
|
| Send contact message | <catalogueName> | JavaScript | Yes | No | |
| Send contact message | Contact Us | JavaScript | Yes | No | |
| Join | Join | Depends | Yes |
Yes (also in statistics, see Conversions > Joining) |
|
| Do a social interaction (e.g. a like or a share) |
social__facebook_like social__facebook social__twitter social__linkedin social__pinterest social__tumblr social__vkontakte social__sina_weibo social__qzone |
JavaScript | Yes | Yes | |
| Print the page | Print this | JavaScript | Yes | Yes | |
| Bookmark the page | Add to favorites | JavaScript | Yes | Yes | |
| Standard tracking via _t URL parameter | tracking__<parameterValue> | JavaScript | Yes | No | |
| Get whitepaper from join block | Download whitepaper | Depends | Yes | Yes | |
| Make a request to an API endpoint (/data/endpoint.php) | API Endpoint | <path> | Server-side | No |
Sometimes (it depends on the API endpoint being called and how it is called) |
Note there are some discrepancies:
- To reduce noise within Composr's inbuilt stats, not every trivial event is logged.
- For better reliability some events for Composr's inbuilt stats are recorded server-side while for Google Analytics they are activated in JavaScript (these are noted as 'Depends').
- Some Composr inbuilt stats events are described as forms being filled in, while the Google Analytics events may be more specific (e.g. a support ticket being submitted). This is because a broader range of form events are captured for Composr's inbuilt events.
Tracking & Referrals
Tracking is useful for many things, including:- Evaluating the success of marketing campaigns
- On social media
- In printed media
- In newsletters
- From partner websites
- (and so on)
- Split testing different page versions to see which performs best (when combined with events)
- Rewarding users for referring new members to the website
Tracking codes are codes associated with a session that help you identify what caused the user behind that session to visit the site, or what split testing is associated with that user. Note that there may be multiple tracking codes associated with a session.
Composr has broadly integrated referral tracking integration:
- The _t URL parameter may contain any tracking code you want to invent (*) and this is automatically registered by the stats addon when the URL is launched by a user.
- The bundled recommend addon automatically includes tracking codes in the mailed URL for: the recommend module itself, the member doing the referral (if applicable), and the page being referred from (if applicable).
- When a member joins, if they were referred by a member then that member will automatically be given points (points bundled addon) and made a friend (chat bundled addon).
- The non-bundled referrals addon allows manually inputting tracking codes on joining and creates a system of referrer rewards.
- The stats addon can draw graph of tracking codes, including measuring conversion rates against them.
- The user lookup tool (in the bundled securitylogging addon) allows easily seeing if that user accessed via a tracking code.
- Tracking is integrated with Tempcode. You can inject a tracking code of your choice in Tempcode by using the Tempcode {\$SET_TRACKING_CODE,some code} or {\$SPLIT_TEST,some code,some other code} symbol. You can use the {\$HAS_TRACKING_CODE,some code} symbol to see if a tracking code is active for the user session.
* Tracking codes are structured as follows:
- Numeric values are for member IDs (referral schemes)
- Other values mean whatever you like and can be invented on whim as long as they are no longer than 80 characters (practically though, keep them very short because of comma-separation as described below)
- Multiple values may be passed together split by commas (for example, to track that a hit came because a member used the recommend module from a particular page)
Split testing
Split testing is a technique to try out different versions of pages and then use statistics to see which performs best. It is also (basically) known as A/B testing and multivariate testing.You can perform split testing by combining tracking codes and events. The easiest way is to use Tempcode to:
- Choose a random tracking code from a set and make it an active tracking code for the user session.
- Generate different output based on the tracking code.
For example, your home page might contain:
Code
{+START,IF,{$EQ,{$SPLIT_TEST,a,b},a}}
   <a href="{$PAGE_LINK*,:join}">Join our website</a>! Free goodies.
{+END}
{+START,IF,{$EQ,{$SPLIT_TEST,a,b},b}}
   We really wish you would <a href="{$PAGE_LINK*,:join}">join</a> our website.
{+END}
You can then measure event success rates based on your tracking codes. Either inbuilt events, or new events you've created.
It's as simple as that!
When we are split testing tiny differences like the above we can be even more concise:
Code
[semihtml]
{+START,CASES,{$SPLIT_TEST,a,b}}
a=<a href="{$PAGE_LINK*,:join}">Join our website</a>! Free goodies.
b=We really wish you would <a href="{$PAGE_LINK*,:join}">join</a> our website.
{+END}
[/semihtml]
Even simpler!
KPIs
Most time-series graphs allow you to add that graph as a KPI. KPIs are special because:- They are available for quick reference from the staff checklist on the Admin Zone dashboard
- You can set targets against the KPIs:
- You can see the targets on the graphs
- You can easily see an overview of which targets have and have not been hit
- Regular notifications will be sent to staff showing whether the targets have been hit or not
Spreadsheet export
Every graph has the option to download the data the graph is generated from, in spreadsheet form. This allows you to manually review it in detail, or use third-party graphing tools.Implementation notes
Privacy
No default graphs or data tables provided by Composr statistics reveal personal information about users – everything is anonymous. This puts the system in line with GDPR (EU privacy legislation).This happens because statistics graphs do not directly use data from the site to render the statistics. Instead, a scheduled task regularly takes site data and generates from it 'data buckets' which the statistics graphs then use. These 'data buckets' only contain data which is necessary to render the statistics and graphs; they do not contain personal information.
Pre-computed statistics
All statistics are generated from pre-computed data, which is itself based on raw data.The pre-computation happens in the system scheduler as the name 'Stats preprocessing'. As such, the system scheduler is required for statistics (and it is highly recommended you have the Cron running at least every 5 minutes, but ideally every minute).
Why do we do pre-computed data processing? There are a number of reasons:
- We can not hold onto raw data forever, due to GDPR (EU privacy legislation), yet we want to be able to see statistics going as far back as possible.
- Some graphs require fairly complicated computations that should not be performed in real-time or repeatedly (for example doing geolocation of users, or tracing behaviour across user sessions).
- We want to be able to process huge numbers of records without performance degradation.
- Generally, we want statistics to be as snappy as possible, so that you feel comfortable dipping in and out of them, and setting different filters. If there's friction, you'll likely not spend as much time looking at your numbers as you should.
- We want generated data to be readily available in other parts of Composr.
How we try to be efficient
For efficiency, the scheduler splits the pre-computations up into two stages:- The calculation stage
Composr will scan for any statistical events that occurred since the last run (but we limit to batches of one hour at a time). The basic details get logged into the stats_preprocessed_delta table with the raw timestamp.- Composr will only generate statistics up to 31 days in the past. Anything that hasn't already been generated over 31 days ago will not be calculated.
- Composr only runs the "Stats preprocessing" scheduler hook for a maximum of about 15 seconds per execution, or until available PHP memory gets low. This is to help avoid timeouts and out-of-memory errors. It also helps ensure that other scheduler hooks can also run. Therefore, you should never run the system scheduler any less often than once every 15 minutes (5 minutes if your site has a lot of traffic) to ensure statistics can keep up. Composr is smart. It will pick up where it left off on the next scheduler run.
- The processing stage
Initially, every statistical event is stored as a separate row in the database with their raw timestamp and string of filters. This is efficient for quick batch insertions during the calculation stage. However, it quickly eats up disk space as the table gets flooded with many thousands of rows (and with redundant data). During the "Stats preprocessing" task, Composr will gradually process everything in the stats_preprocessed_delta for efficiency. This involves the following:- Grouping statistical events together that occurred within the same one-hour period (our graphs do not go beyond hourly precision anyway)
- Fragmenting the filters so that multiple events that use the same string do not save many copies of the same string (stats_preprocessed_filters and stats_preprocessed_filter_maps).
This two-step process helps ensure that sites large and small do not get bogged down by statistics processing. This also drastically reduces the amount of disk space used by the statistics addon.
This is not a fool-proof strategy:
- Very large sites may experience very slow updating of statistics graphs or even out-of-memory errors in rare circumstances. At that point, you have grown to the point that you should probably consider off-loading your analytics to a third-party service instead.
- Statistics from the most recent hour may not reflect in the graphs. Since we group events together by hour, we cannot process statistics in the stats_preprocessed_delta table until the current hour ends. Otherwise, we will have duplicate records and counts.
- Additional computations have to run when loading the graphs since we fragmented the data (to preserve memory and disk space).
You may also notice, under the Admin Zone > Audit > Low-level logging > System scheduler hooks, that 'Stats preprocessing' will alternate between running every minute and running every 15 minutes. In normal operation, it will run every 15 minutes instead of every minute because it uses a lot of memory and database queries. However, under any of the following circumstances, it will run every minute until none of these circumstances apply anymore:
- The latest pre-processed stats are over an hour ago (it needs to catch up)
- During the previous run, it stopped early because it approached close to the PHP memory limit
- During the previous run, it stopped early because it was running for more than 15 seconds
Limitations
One limitation, to preserve site stability, is that statistics from over 31 days in the past will not be pre-processed if they have not been so already. Additionally, stats will only be processed one hour at a time. We have found that sites will completely lock up even on performant dedicated servers if statistics have to pre-process lots of data. This means you could experience a gap in your data if any of the following occur:- The system scheduler stops working for 31 or more consecutive days
- The statistics module repeatedly fails to pre-process data over the course of 31 or more consecutive days
- You manually delete existing statistical data from Admin Zone > Tools > Cleanup Tools, or from the database
- You use the site importer (imported content from over 31 days ago will not be factored in the statistics)
- You run the automated test suite for stats (testing_platform non-bundled addon)
It is very important that you maintain and test regular backups of your database in the event that you lose statistical data.
Time zones and start-of-week
All times are shown on the graphs in the configured website time zone, regardless of the time zone of visitors or the time zone your own account is configured to. This is a necessary limitation based on how statistics are pre-computed.Some graphs allow showing hour-by-hour stats and also filtering by country, in which case you may get an idea for the local times by manually considering any local time zone differences.
The statistics system does not respect the ssw (Week starts on a Sunday) configuration option; week graphs always start on a Monday due to limitations in PHP's date functions and the fact the data is already pre-processed and cannot be changed if you change this option.
Quarterly graphs are based on month; Q1 runs January 1 - March 31, Q2 runs April 1 - June 30, Q3 runs July 1 - September 30, and Q4 runs October 1 - December 31.
Accessing other statistics
View counts
View statistics are shown for various forms of content
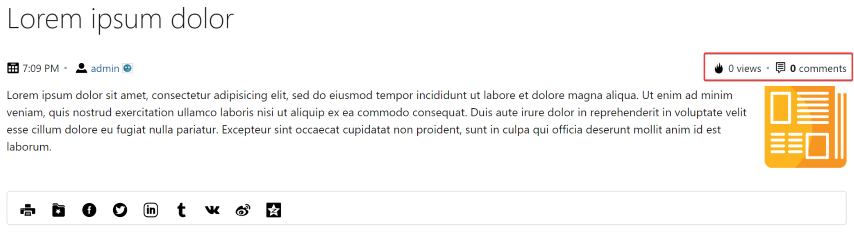
(Click to enlarge)
An example of this would be news entries: each news entry records how many times it is viewed, and displays this number on its view screen.
The main_multi_content block can also be used to draw out content based on popularity.
The statistics block
The side_stats block
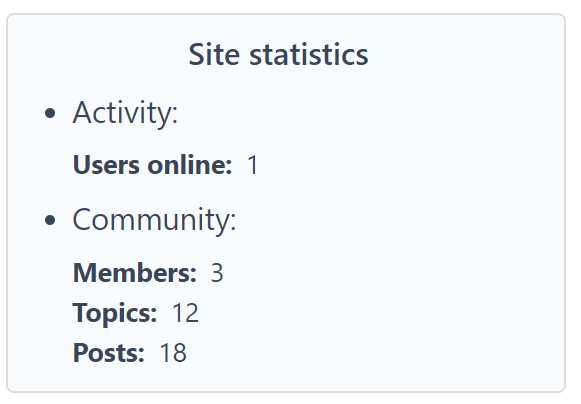
(Click to enlarge)
The statistics graph block
The main_staff_stats_graph block
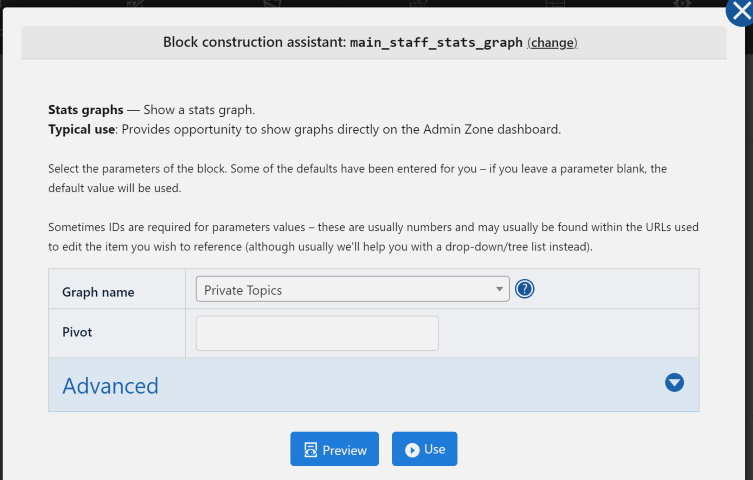
(Click to enlarge)
The param of the block is the name of the graph you want. These are defined in the hooks/modules/admin_stats hooks under info() (the array keys).
Do not be fooled by the name main_staff_stats_graph; a visitor does not have to be a staff member to see the graph (no permissions checking is done) unless it is placed on a restricted page (e.g. the Admin Zone dashboard).
There are some other parameters you may be able to specify depending on the graph and their available pivots and filters:
- pivot: The codename of the pivot to use for this graph (see Source_hook_stats_provider::get_date_pivots() in sources/stats.php for common ones you can use)
- <filterName>: Apply a filter to the graph. The <filterName> is based on what is available for the graph as defined in the info function under 'filters' (strip the graph name and the double underscore; for example, to define a 'graph_name__enabled_only' filter, just use 'enabled_only' as the key)
- day_range: This filter behaves differently; you must use day_range__start and day_range__end instead. The value is the day number since epoch. There are also special numbers you can use:
- day_range__end: If you define 0, then the graph will end on today. Negative numbers will look ahead that many days into the future from now (though generally you would not want to do that).
- day_range__start: A negative number means that many days in the past compared to the end. For example, -365 means the graph will start about a year ago. Be very cautious about this; the graph will try to render points even if the stats do not go back that far. If you specify too far in the past (e.g. you set this to 0), you could encounter server crashes or out-of-memory errors.
- day_range: This filter behaves differently; you must use day_range__start and day_range__end instead. The value is the day number since epoch. There are also special numbers you can use:
Real-time analytics
Real-time analytics
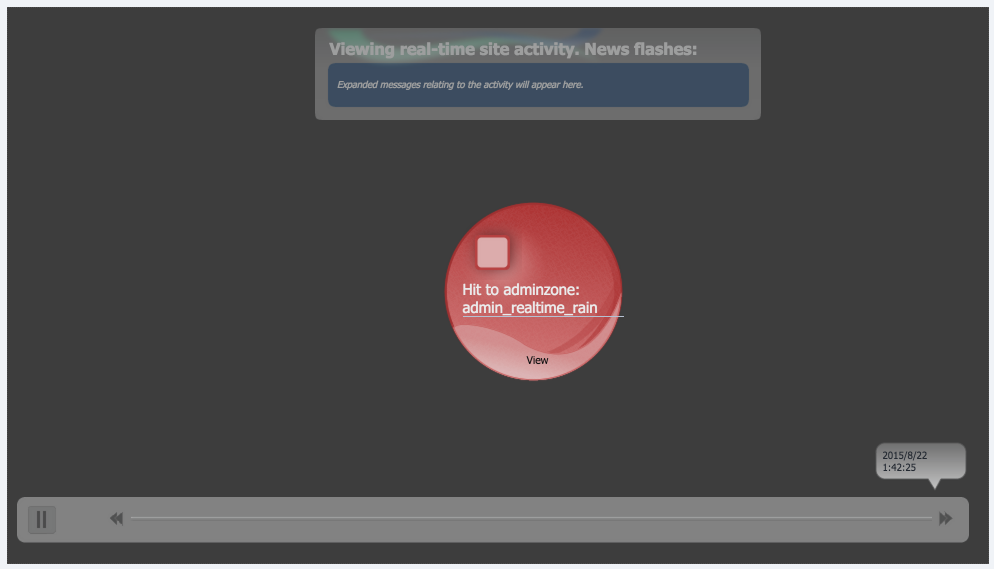
(Click to enlarge)
Access Real-time analytics from:
Admin Zone > Audit > What's happening now (RTR)
It is a good way to visualise how people are using the site. This works best when the site has multiple online users performing options, but you can move the timeline back to when stuff was happening previously (i.e. view activity from a historic viewpoint).
Real-time analytics: Keys
Each bubble in the graph has its own colour depending on the type of analytic:- Blue Gray - Action log entry added
- Light Brown - Banner clicked
- Maroon - Calendar event starting
- Indigo - Chat message sent
- Green - New member joined
- Forest Green - New forum post (new topics always also contain a post)
- Brown - eCommerce transaction
- Orange - News/blog entry posted
- Blue - Point transactions*
- Teal - Point Escrows*
- Dark purple - Website poll closed
- Purple - Someone recommended the site or a page to someone else
- Lime - A member performed a search
- Red - Hack-attack was triggered*
- Dark Red - Failed login attempt
- Gray - A page was viewed
- Yellow - A warning was issued to a member*
Non-bundled addons:
- Yellow Orange - Achievement earned
*Bubbles can also have an 'effect' which is something that surrounds it. When a bubble has an effect, there is additional context:
- Halo - A positive action
- Member sent points to another member
- Escrow completed / satisfied
- Horns - A malicious action
- Escrow cancelled
- Hack-attack with a risk score of 5 or higher
- Formal warning issued
- Shadow - A deduction of some sort
- Points were debited from a member
- Sun rays - An addition of some sort
- Points were credited to a member
Browsing basic logs
You can use the "Investigate user" feature (from the securitylogging addon) to view all the hits from particular members and IP addresses. You just do a search from that module.You can also do a blank search to just see miscellaneous logged hits, which will give you a sense for general traffic patterns.
Concepts
- Referrer
- A page of a 3rd-party website linking to a page on your website.
- Geo-location
- The process of using some type of individually-identifiable information to find out where in the world somebody is.
- KPI
- Key Performance Indicator, a measurement that has been chosen for marketing purposes.
- Multivariate testing
- An analytical technique to see which of multiple variations performs best.
- Split testing
- The same as Multivariate testing. A more conversational way of putting it.
- A/B testing
- Multivariate testing with exactly two versions (original version and 1 variation).
See also
- Using IP addresses to trace users
- Analytics and split testing, using Google Analytics
- https://www.razorsocia…al-media-analytics-tools/
Feedback
Please rate this tutorial:
Have a suggestion? Report an issue on the tracker.